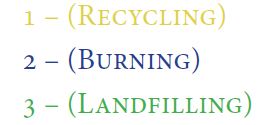
Waste Recycling; a Link to Environmental Safety and Healthy Living in Nigeria
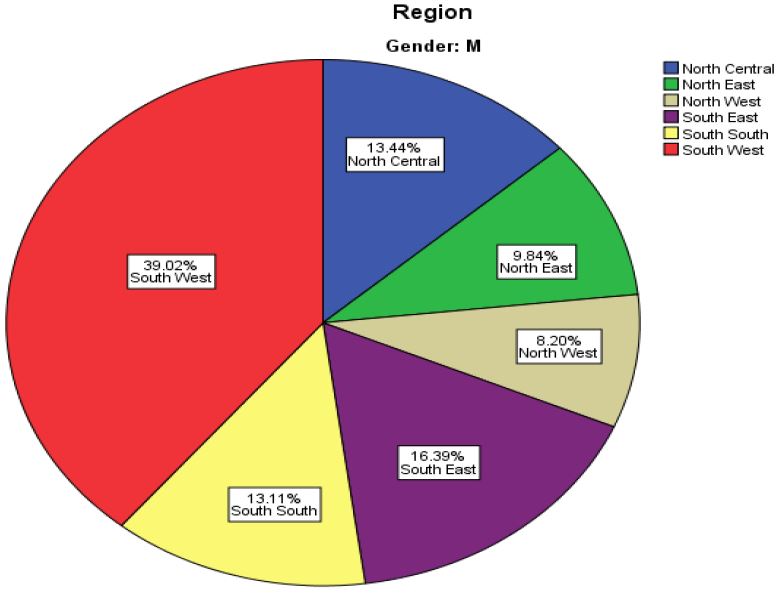
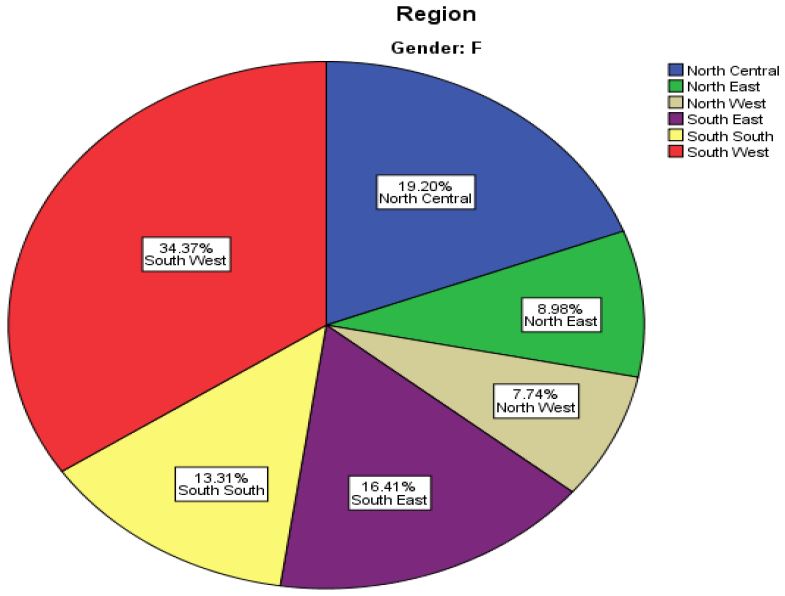
The manner of waste management calls for proper monitoring to reduce climate change, global warming and other related issues like health degradation & loss of revenue that can result from improper management of waste. This Study focuses mainly on the option of waste recycling which is believed will benefit the entire nation. The purpose of re-using some of our waste cannot be overemphasized; this brings to our consideration the term recycling, its effect and benefits to the safe environment and healthy lifestyle. Online questionnaire and individual interview of residence across some part of the nation gives total respondents of six hundred and twenty-eight (628) people, three hundred and twenty-three (323) of which are female(F) and three hundred and five (305) are male(M). The Respondents ages range from eighteen-sixty-five years. Two hundred and forty-six (246) female proposed recycling as a means of waste disposal, while fifty-three (53) suggested landfilling and twenty-four (24) suggested burning. The number of Male in support of recycling is two hundred and forty-five (245), forty-one (41) supported landfilling and nineteen (19) supported burning. The region with the highest participant is south-west with a total participant of two hundred and thirty (230). It is the region with the highest availability of waste disposal facility.
Keywords: Waste; Recycling; Safety; Healthy LivingRESEARCH
Considering Kemp (1998) as cited by, waste generation is mentioned as an integral part of everyday activities, that denotes a material, substance, or by-product discarded or eliminated as no longer useful or required after the completion of a process [1]. It can be categories based on its source as clinical waste, domestic waste, agricultural waste, industrial waste, and nuclear waste. It can be in the form of solid, liquid and gas, possessing properties such as inert, toxic and carcinogenic wastes. The rate of generating waste is always higher than its collection and evacuation rate and this constitutes environmental nuisances. Waste management is a global concern, not limited to resident or state alone. The incapability of people, government and waste disposal firms to maintain waste management task and the environment constitutes a problem to a country. Waste disposal management becomes a great challenge as there is an increase in population and development of industries of a Country. Years back trash were transported and dumped in the places far away from the city or village. In recent times, a lot of methods have been derived for waste disposal management, some of which are; Landfill, Incineration, and Recycling. The people are prone to various threats instituted through improper waste management (disposal or storage) hence, polluting water, air, and land, leading to health degradation of people and environmental deterioration. A common sight in some part of the nation today is piles of wastes littering places like residential areas, main roads, drainages, and unoccupied plots of land [2]. Solid waste management thus encompasses generation, storage, collection, and final disposal according to Omuta (1998) which was reviewed by Uwadiegwu BO, et al. [3]. Though wastes are viewed as useless, it has been proved that adequate materials can result from them and aid human’s demand to improve the livelihood. Waste recycling has been in existence from the year 1031 in the history, with Japan who began the first ever reuses of waste paper, other countries have been involved up to the present moment [4]. Waste recycling involves, re-generation of used material into worthy substances, the process involves generation from domestic/industrial areas, collection by scavengers/waste disposal workers, selling/donating to manufacturers for utilization. Based on the research carried out by Ojolo S, et al. they emphasized that “large quantities of cow wastes are generated, which could be used as biogas inputs to complement the fuel usage alternative” [5]. Also, in his journal highlighted that waste bottles can be used in the construction of buildings in lieu of concrete blocks by putting the sand into them [6]. The mixture of pet bottles with broken glass can also be used to mould bricks for construction according to Behera D, et al. [7].
In recent research carried out by Gaonkar M, et al. it was discovered that eggshells serve as a good source of calcium and useful as fertilizer [8]. Extracted from Fashion Journal, as stated by Vigilante S, et al., Chewing gums can be recycled into a shoe tag Gumshoe which is very durable for sports activities [9]. Rani S, et al. concluded in their journal that recycling of scrap tires produces oil for industrial purposes [10]. Though the management of waste involves large investment and involvement of workers, a good waste management practice will re-generate revenue. The effect of recycling practised on a small scale in Lagos, Nigeria, has not been totally felt due to inadequate consideration from the government [11]. The nationals are not educated on how to manage their waste, hence find it difficult to dispose of the generated waste properly, in most cases, valuable materials that would have turned out as meaningful products are thrown away. Recycling as a means of waste management involves huge resources though; its benefits cannot be undermined. The adoption of recycling as a means of waste generation will reduce energy consumption, decrease pollution, removes health and environmental hazards resulting from landfilling of untreated electronic waste (e-waste) such as television, cellphones, computers etc. and other forms of waste [12]. An online survey and personal interview will be conducted to know people’s view about the manner of their waste management. This Study focuses on evaluating the waste management service and disposal method acceptance level across the geopolitical zones in Nigeria using opinion sampling method via the distribution of questionnaires. Thereby creating a better understanding of waste management to reduce health deterioration, increase revenue and sustain good environmental condition.
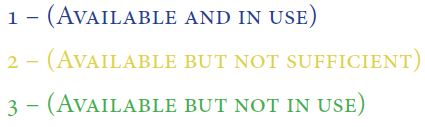
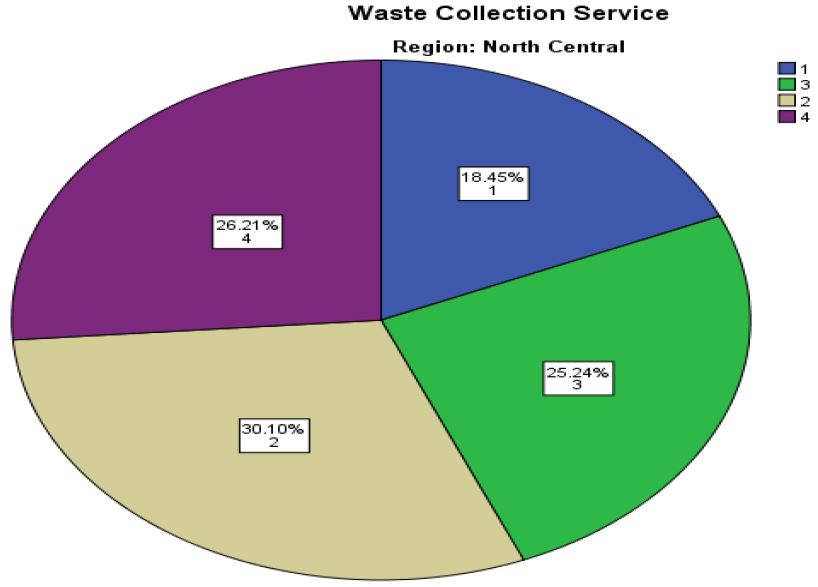
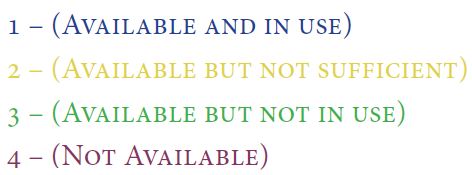
A survey was conducted across the six geopolitical zones comprising of North Central, North East, North West, South East, South South and South West. The respondents (Males and Females) who are aged 18-65 years give answers to the survey questions on, the availability and in use, non-availability, availability but insufficient, availability and not in use of waste management service. A total of six hundred and twenty-eight (n=628) were contacted both online and through individual interview across the nation. The frequency and percentage of respondents based on each survey question was calculated using the SPSS (Statistical Package for the Social Sciences) software.
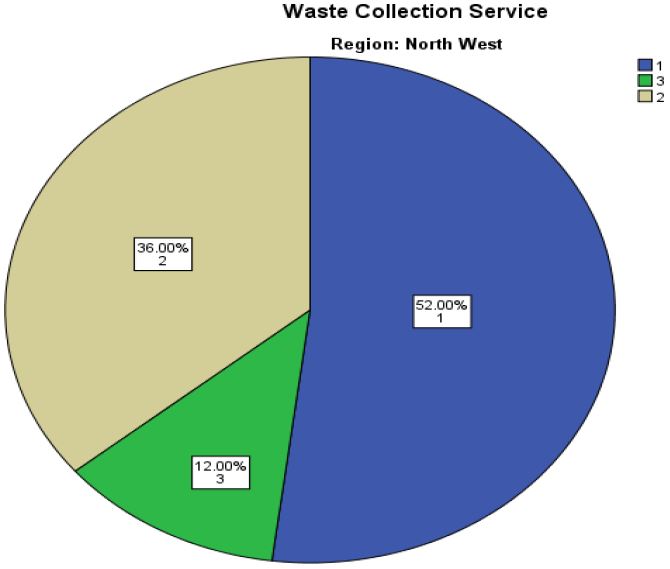
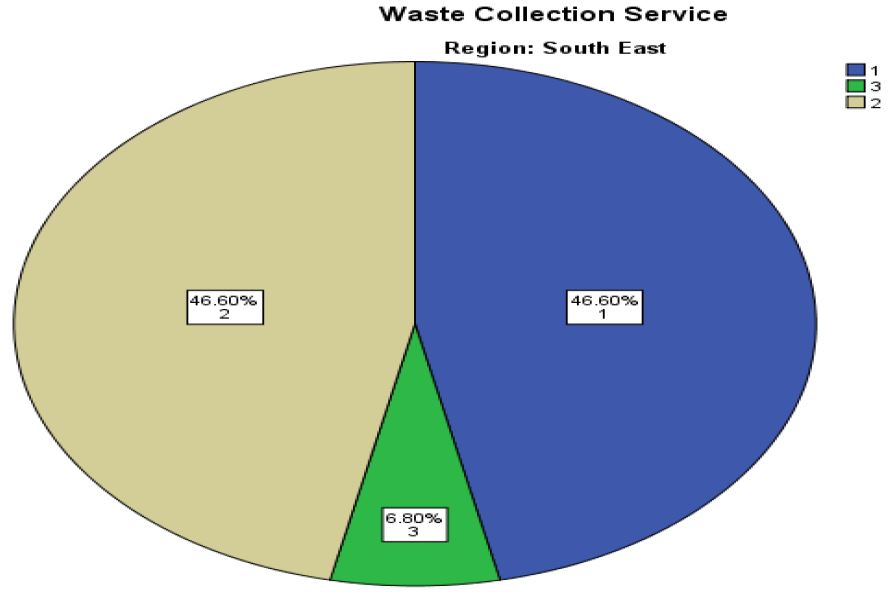
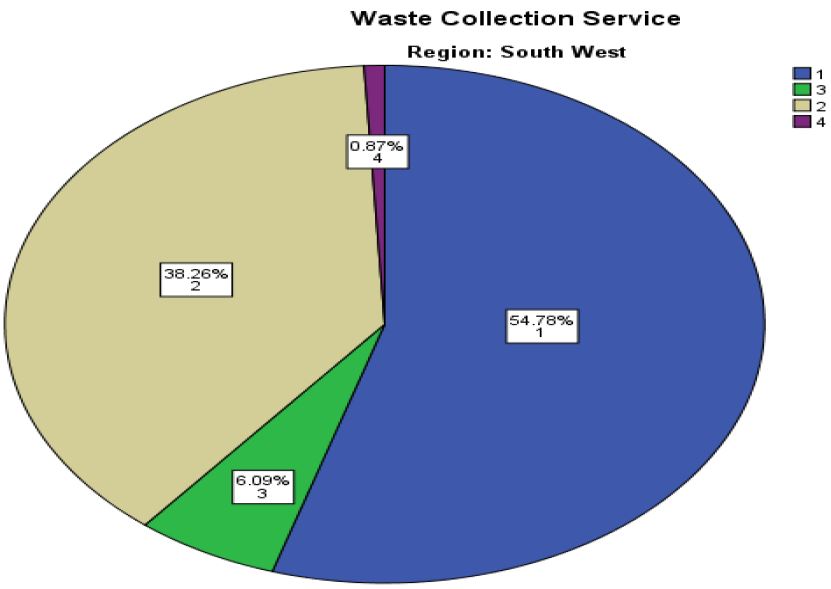
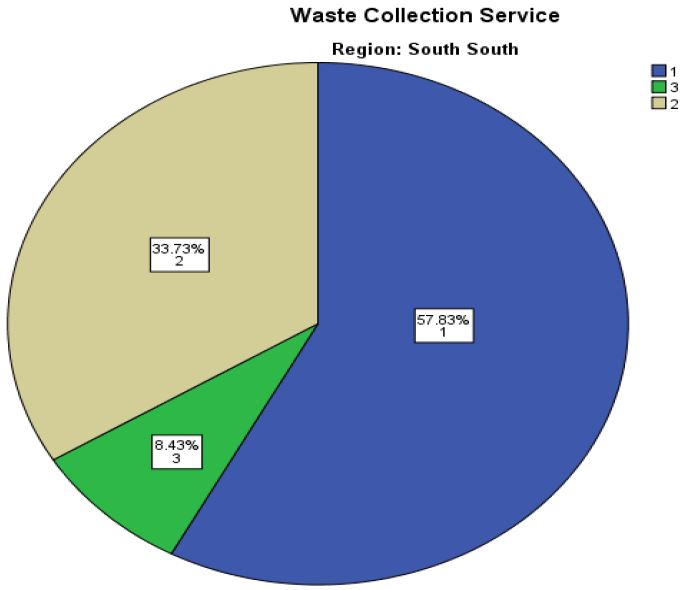
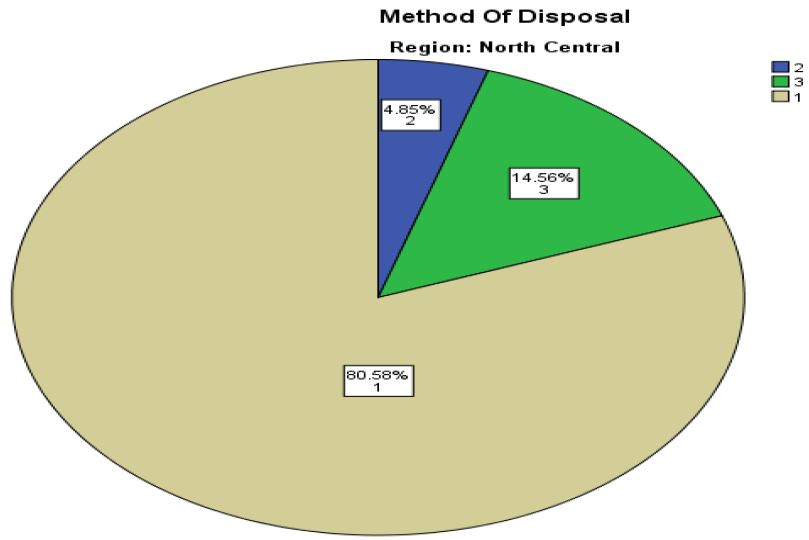
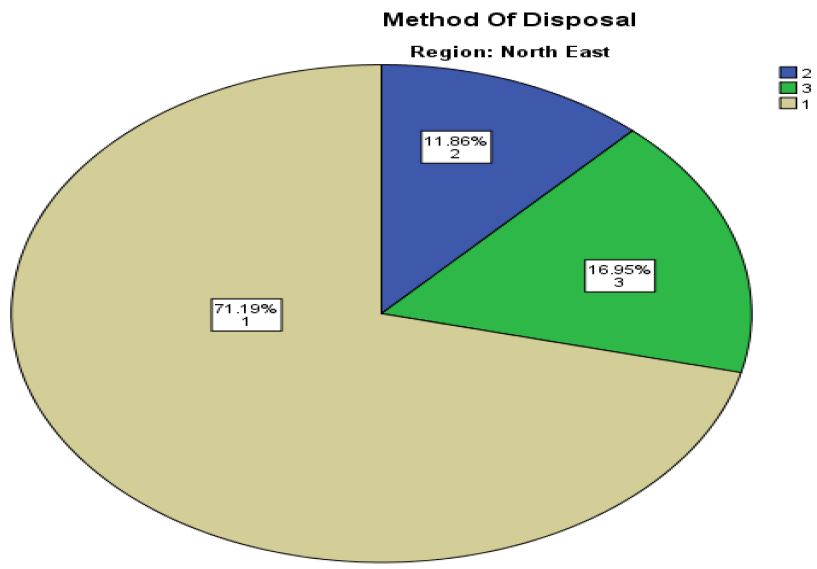
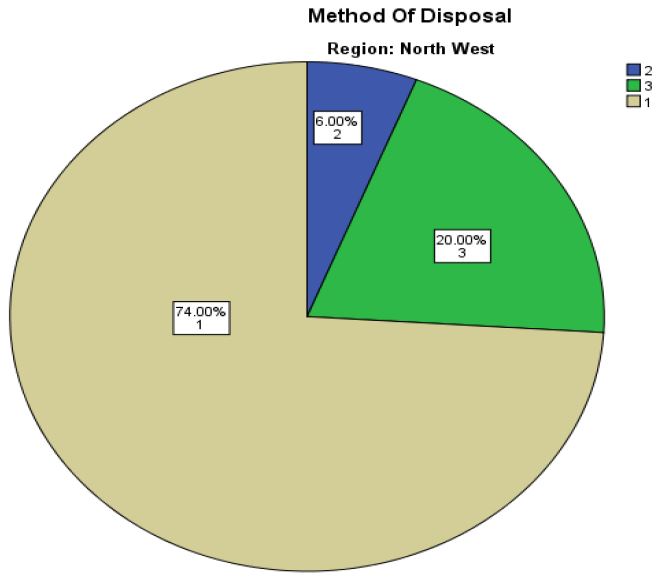
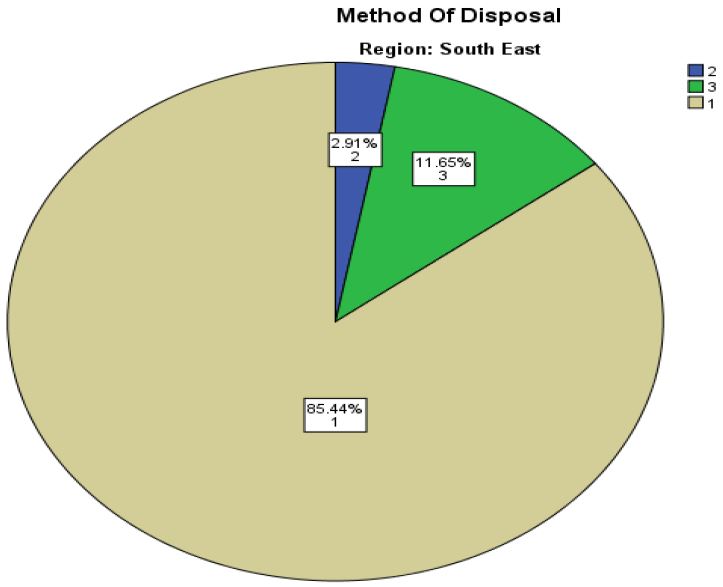
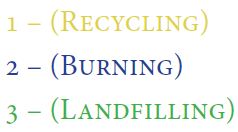
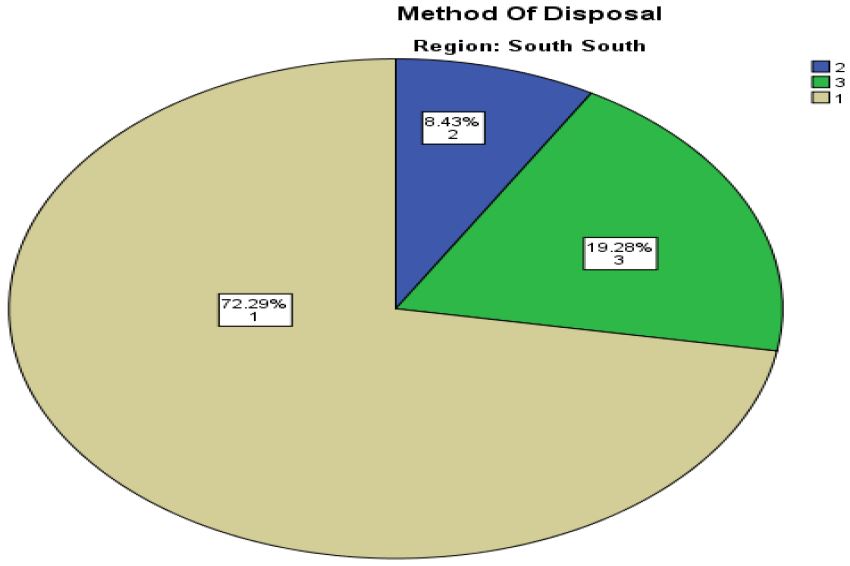
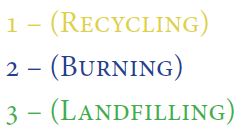
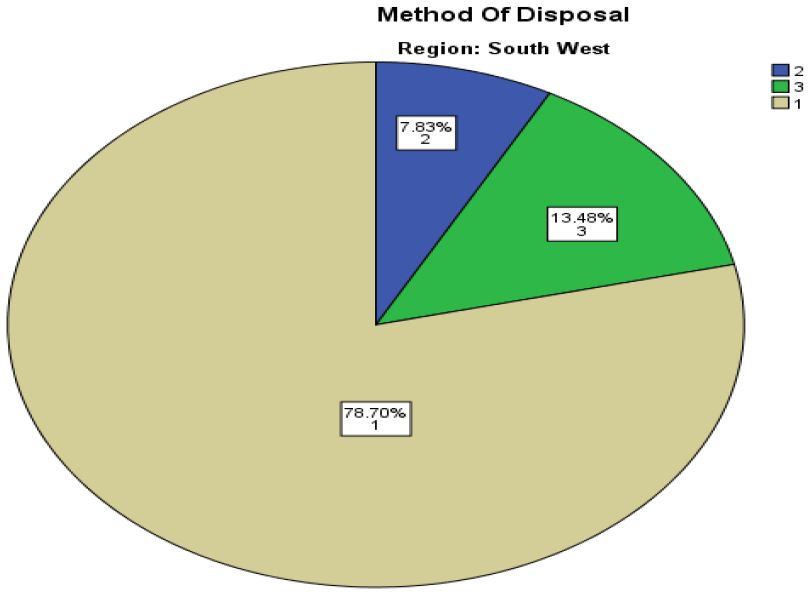
With a total of six hundred and twenty-eight (628) respondents from the six geopolitical zones of Nigeria, three hundred and twenty-three (323) of which are females and three hundred and five (305) males of ages ranging from eighteen-sixty-five years. Table 1 indicates the percentage of male and female respondents from each geopolitical zone, the highest percentage of male and female results from the South West zone, having a 39.0% male and 34.0% female. On the other hand, the North West zone showcases the least percentile of male and female of 8.2% and 7.7 % respectively (Figure 1). Table 2 discloses that the South East has the highest percentage of 46.6 indicating that waste collection service is being available but not sufficient. South South recorded 57.8% of the waste collection service is available and in use as the highest percentage throughout the zones. The South West Zone has a percentage of 6.1% which is the lowest of all the zones indicating waste collection service is available but not in use, North Central recorded the highest percentage of 25.2% showing that the service is available but not in use. Three of the zones has no record of non-availability of waste collection service, a South West zone with 0.9% has the least record while North Central with 26.2% has the highest record (Figure 2). Table 3 showcase the respondents view on disposal method, South East zone has the highest percentile of 85.4% while North East has the lowest of 71.2% in support of the recycling method. The South West Zone has the lowest percentile of 2.9% while North East has the highest of 11.9% in support of burning. A percentage of 20.0% from North West Zone was recorded as the highest percentile in support of landfilling while 11.7% from South East zone is ranked the lowest in support of landfilling (Figure 3). The collected data, therefore, indicated that recycling as a means of waste disposal/management has the greatest percentage across all the six geopolitical zones. The region with the highest participant is south-west with a total participant of two hundred and thirty (230) and north-west of total participants of fifty (50) has the least number.
Having emphasized waste management with thorough consideration of recycling method which has the greatest percentage across the country’s geopolitical zones, and a way to limit environmental pollution resulting from waste, enhance preservation of rainforests and natural resources, thereby increasing raw materials and reducing energy consumption. It can be concluded that majority of the discarded waste are useful materials for other purposes. A good recycling waste management practice in the country will be highly welcome by the citizens considering the outcome of this research work, it thereby calls for an adequate government policy which will encourage investors to be involved in the business, thereby elevating the healthy condition of the nation and increasing the revenue generation. There should be a good strategy to encourage people’s participation by submitting the waste generated to the waste management workers and follow the laydown rules regarding disposal process. The government will need to provide tagged waste bins at strategic places within the residential areas, marketplaces and other commercial places to aid waste collectors and enhance proper segregation, for further utilization. The hazardous waste must be totally segregated to avoid the unfavourable situation. It is therefore believed that nothing is totally a waste and a good recycling practice will bring about a good change in the country eco-system.
The research work is supported and sponsored by the Covenant University Centre for Research, Innovation and Discovery.