Water Users Association and Irrigation Performance in Eastern Province of Rwanda
Achievement of sustainable food security requires safe water use in irrigation, through an establishment of effective policies and strategies related to water resources use. This study assessed the role of water users association (WUA) in the irrigation performance at local level in Eastern Province of Rwanda. Three dominant irrigation sites such as: Kagitumba, Nasho/Mpanga, and Gashora were studied and a total sample of 563 farmers distributed into five WUA participated in study and three Key informants were selected. The methods used to gather the data included transect walk, focused group discussions, interviews and survey. The result showed that the WUAs play a key role in irrigation performance through active participation of farmers in repairing the irrigation infrastructures, promoting functionality and sustainability of irrigation infrastructures. Nevertheless, the occurrence of disasters (drought, flood), inaccessible source of energy and price fluctuation of the harvest hinder the technical, agronomic and economic performance of irrigation in Eastern Province.
Keywords: People Participation; WUA; Irrigation; Rwanda
Over 800 million of people worldwide suffer from the hunger and great party live in developing countries whilst its major causes are related to the conflicts and natural extremes dominated by flooding and drought resulted from the impact of climate change [1]. However, among of the strategies proposed to tackle worldwide high food demand, irrigation is among of them. Irrigation sector is projected to increase water withdraw by 11% of current situation in 2050 [2]. Therefore, an ultimate commitment and participation of different stakeholders who have an impact on water resources use efficiency such as water users, researchers, institutions and policy makers are highly needed [3]. In addition, the achievement of sustainable development goals (SDGs) goal 2 and 6, both aiming at ending hunger, food security, improving nutrition, ensuring the availability and sustainable management of water resources for all [4], have to come through the enlargement of existing water supplies and policies of water resources and irrigation [5,6].
Globally, over 70% of fresh water withdrawals consumed in agriculture, mostly to irrigate the cropland and over past century an area equipped with irrigation have been doubled, from 1.4 million km2 in years 1961 to 3.2 million km2 in 2012 [7-9]. Meanwhile, the existing water resources management strategies, infrastructures, policies enforcement are not suitable for this high-water demand and use in irrigation mainly in the developing countries [10-15], area under irrigation in Africa is estimated to 13 million hectares which is 6% of the total area under cultivation, comparing to 14% in Latin America and 37% in Asia [16].
Knox, et al. indicated that different strategies of water policy such as: water users associations (WUA), water use permit, water pricing, public and private participation together with strong institutional framework have a great impact on irrigation performance and water resources management in general [17]. For example, water pricing has a great effect on the reduction of water demand in agriculture while increasing water use efficiency [18], however, it can affect negatively the crop variabilities, employment and farmer’s income [19,20]. In addition, a study conducted in Tanzania, one of the bordered countries with Rwanda, revealed that the people participation in governance of water resource, WUA, and other stakeholder’s participation enhanced an effective management of Usangu plains through water allocations and collaborating with government to implement the projects related to the management of water resources in the region [21]. Therefore, implications of different actors in water resources use in irrigation, lead to the collaboration, establishment of baseline and criteria for which enhancing the sustainable exploitation and management of water resources, priority constraints to be given in water allocation, evaluating possible solutions, recommend technologies and policies, as well as enhancing monitoring and evaluation of the impacts that may occur [22-26]. In Rwanda, 62.2% of total country land is under agriculture on hillside and marshland [27]. Therefore, to achieve sustainable water use in agriculture current water resources and irrigation policies, propose active participation in the activities of water management as baseline to achieve the irrigation performance and food security. The establishment of WUA facilitates the decentralisation of water management activities to the grassroot level, are among of the major strategies of water policy aiming at the achievement of long-term program of agriculture transformation in Rwanda, known as also Crop Intensification Program [28-30].
It is in these regards, this article aims at assessing the role of water users association in the irrigation performance at local level in Eastern Province of Rwanda. Specifically, identifying the role of people and private sector participation on irrigation performance and evaluating the contribution of WUA on irrigation performance. Three different major irrigation sites selected, included Kagitumba; Gashora and Nasho/Mpanga irrigation site were selected to be conducted in this study because of different established irrigation infrastructures and surface coverage. The findings will contribute to providing the evidence based to make informed decisions on how WUA are contributing to the enhancement of irrigation performance in Eastern Province towards to sustainable food security and effective water resources exploitation.
This study was carried out in three different irrigation sites of Eastern Province of Rwanda such as: Kagitumba; Nasho/Mpanga; and Gashora in the period of May to July 2018. The study area was selected due to the marshlands and hillside irrigation developed in these regions, as an alternative solution to the effect of climate change appeared in the form of extended drought lasted from three past decades in Eastern Province of Rwanda. Hence, irrigation was introduced to exploit the lakes and rivers found in this region as supplementary to rainfed water source to achieve sustainable food security [31].
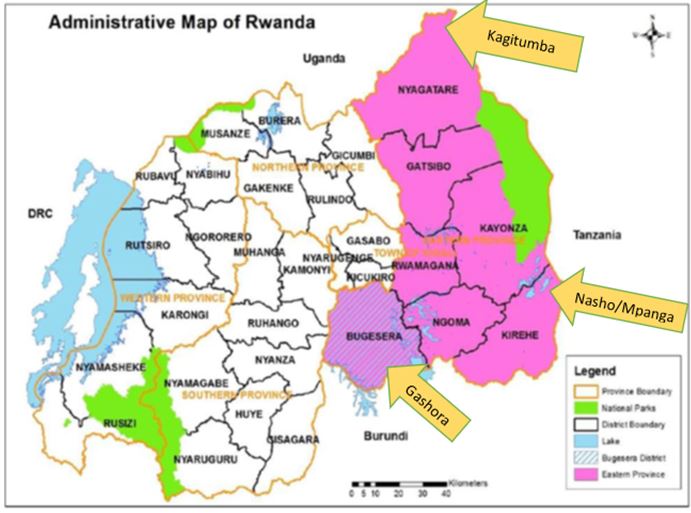
Eastern Province of Rwanda is one of the four provinces constituting Rwanda. It is lying between latitude 1°45’00’’ and Longitude 3°30’00’’ (Figure 1). It is characterised by annual rainfall varying between 827mm to 1200mm distributed into two seasons, moreover, above 80% of the population of Eastern Province are the agriculture farmers, farming mainly cereals, grains, horticultural crops and raising cattle [32]. Kagitumba irrigation site covers over 1000ha, it is located in Nyagatare district in the North-East of the province, whereas Nasho/Mpanga irrigation site covers 464ha and it is located in Kirehe District in South East of the Province finally Gashora irrigation site covers over 200ha, it is located in Bugesera district in South-West of the province (Figure 1).
A triangulation model was used to gather the data from different sources. The respondents participated in this study voluntary and they were explained before the intention and purposes of this research. A researcher was required first to present himself at land irrigation and mechanisation officer working in the irrigation site for any assistance that would be required, in accordance with research authorisation letter gotten from Rwanda Agriculture Board (RAB).
A mixed method was used to gather the data from the field. The methods used included transect walks along small and big farmers who use irrigation, survey, focused groups discussions and interviews conducted on the key informants of local entities in charge of agriculture and managers of WUA in the respective selected irrigation sites.
The research started by transect walking in the field checking the working condition of irrigation machines, status of crops grown and irrigation type the farmers use. The farmers’ survey was done using both unstructured and structured questionnaires originally designed in English, then translated into Ikinyarwanda which is a local language that every farmer can easily understand and provide the answers accordingly. The survey helped us to collect the quantitative and qualitative data related to the specific role of farmers on water use in their respective irrigation sites and the contribution of WUA on irrigation performance. Therefore, using method of Krejcie, et al. [33], a total sample of 563 farmers participated in this survey. A randomised research design used to gather the data whilst a focused group discussion formed by five to seven farmers were used to discuss on the frequent challenges they face in irrigation and possible solutions as well as the contribution of people and private sector on irrigation performance. In addition, a purposive research design was used to draw the key informants to interview on the contribution of the government’s strategies in the enforcement of water policy as well as the level of the private sector involvement in irrigation in general. WUA managers were also interviewed on the working conditions status of their respective WUA.
The quantitative data collected during this study were coded and statistically analysed using SPSS software version 23, with level of significance 95% (p<5%). On the other hand, the qualitative data gathered using the focused groups and interviews were analysed and interpreted in thematic way depending on the subject.
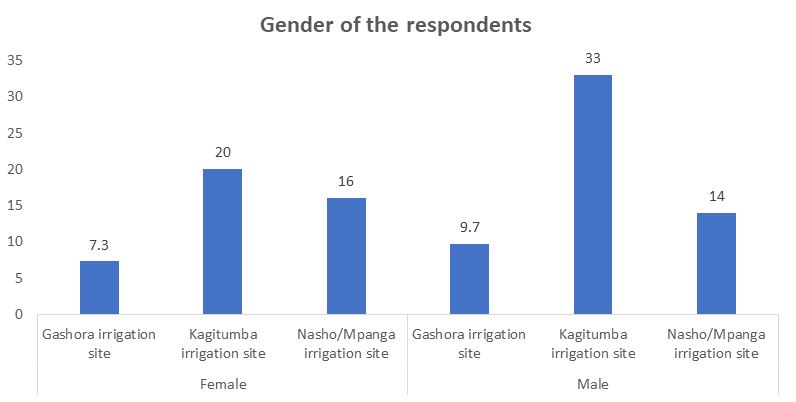
During this study, the farmers from Gashora irrigation site represented 17.2% of the respondents whereas 30% of the respondents were from Nasho/Mpanga irrigation site and 52.8% of total farmers were from Kagitumba irrigation site. In addition, 20% of the respondents were male from Kagitumba irrigation site while their counterpart women were 33% of the respondents. Male and female farmer from Nasho/Mpanga irrigation site were respectively 14% and 16% of all respondents. However, 9.7% of the all respondents were male from Gashora irrigation site while 7.3% of the respondents were female from Gashora irrigation site (Figure 2). The EICV 4, 2013/14 report indicated that 67.9% of Rwandan population involves in agriculture activities where by female is more involved in agriculture compared to male and most of them are in subsistence agriculture.
The level of education of the farmers play a vital role in water management in agriculture due to facilitation of knowledge transfer and enhancement of learning that help environment protection and shifting from subsistence agriculture to fully agriculture with technology [34]. Therefore, during this study,0.36% of the entire population were university graduate were farmers from Kagitumba irrigation site, whereas, 2.49% of all respondents were farmers from Kagitumba irrigation site who attended secondary education while 47.7% of the respondents were farmers of Kagitumba irrigation site who attended primary education. However, 2.13% were farmers from Kagitumba irrigation site who did not attend any school. In addition, 1.78% of the entire population were farmers from Nasho/Mpanga irrigation site who attended secondary education whereas 22.56% of the farmers from Nasho/Mpanga irrigation site attended primary education and 5.68% did not know how to read and write. Though at Gashora irrigation site, 0.18% of the all respondents who participated in this study were university graduate whereas 16.16% of the all respondents from Nasho/Mpanga irrigation site studied primary school while 0.53% did not know how to write and reading.
Therefore, based on the findings, most farmers, who participated in this study, had basic knowledge on writing and reading which may enhance the knowledge transfer and training on water management in irrigation. Hence help in implementation of the policies proposed regarding water use and agriculture. In meantime during the focused groups, the farmers highlighted “even though they know how to write and reading, the trainings on water use need to be offered through practical way because some time they do not find time read the booklet, because of other post farming activities in their families.’’
Current water resources management policy of Rwanda of 2011, together with irrigation policy of 2014, highlights the role of public participation and private sector in management of the water resources and irrigation infrastructures. The main participation of both public and private sector appears in training on irrigation management and water use management technics and awareness rising on sustainable agriculture productivity and production.
Training on irrigation performance: During the focused group discussions, the farmers on one hand indicated that the trainings on agriculture in general are issued at the beginning of every agricultural season. Rwanda Agriculture Board (RAB) is in charge of the training where the skilled technicians and agronomist give trainings to the farmers on seed selection, pest control, water use and post-harvest technologies. On the other hand, farmers vote for the agriculture extensionists who help them to reinforce the training gotten from RAB. The agriculture extensionist are the benevolent farmers when there is an urgent matter, in return the extensionists give trainings to the farmers through public works ‘Umuganda’. Umuganda is development policy initiated by Government to increase people participation in development activities of the country. The farmers added also that irrigation engineers, local leaders and extensionists always have a moment during Umuganda to educate on the role of irrigation in Agriculture and water saving technics. In addition, the trainings also related to irrigation development are conducted in the respective farmer’s cooperative and WUA. The farmers enumerated also that once there is a damage of water ways or feeder roads, through public work (Umuganda), they plan together with the local leaders to repair them without waiting for direct support from Government depending on the intensity of damage; Government can intervene to help the farmers for repairing and establishment of new water infrastructures. During the focused group, the farmers highlighted that the training on water saving and its efficiency use in irrigation training are not enough. Generally, in 2015 Umuganda contributed over $25 million to national income through the activities related to agriculture and construction of feeder roads [ 35].
The participation of people in water management also appears in the involvement of farmers in management of the infrastructures built. Mostly, the government is in charge of building new irrigation infrastructures in cooperation with the private sector and the established infrastructures handed over to the farmers hence the government oversees their usage. It has been proven that people participation and their full involvement in management and repairing of water infrastructures and irrigation performance determination, increases the ownership and responsibility in management, and hence reduces the irrigation cost of inputs [36].
Categories of actors involving in irrigation infrastructures management: The different stakeholders involving in repairing the damaged irrigation infrastructures vary depending on the intensity of damage. The major actors included: farmers, WUA, private sector and government itself. Therefore, 10.7% of the respondents from Nasho/Mpanga irrigation site use WUA to repair the damaged infrastructures, likewise 24.2% of the respondents from Kagitumba irrigation site.
However, 13.6% of the respondents from Gashora irrigation site repair themselves irrigation infrastructures damaged. Meantime, 11.5% of all respondents from Kagitumba irrigation site and 3.7% Nasho/Mpanga irrigation site repair themselves infrastructures once they are damaged. Whilst the permanent irrigation technicians allocated to each irrigation site help to repair some infrastructures like pumps and other hydraulic damage which requires high scientific knowledge. Hence, 3.5% of the all the respondents from Gashora irrigation site use irrigation technicians whereas 15.6% of the all respondents from Nasho/Mpanga use irrigation technicians to repair some technical damage of the pumps and water networks, likewise 17.0% of all respondents from Kagitumba irrigation site use the permanent irrigation Engineers working at their irrigation site ( Table 1).
Generally, the participation of the farmers through their own groups or associations contribute to the sustainability of the infrastructures while reducing the public expenditures and improve efficiency equity as well as improve standards of services [37]. Therefore, in Eastern Province of Rwanda, the active collaboration between different actors in irrigation management plays a vital role to the sustainability of irrigation infrastructures built, declared by the Key Informants during the interview.
Farmers participation and their perception on food security: According to FAO, 2017, food security refers to the status of food availability, accessible to the people either from market or from their farm production and utilised for the sake of impacting positively the nutrition status of people [1]. During the focused groups the farmers highlighted that, they plan their agriculture activities with respect to crop’s suitability with their land and the common crops calendar set in general meeting on village level. It has been proven that active participation of farmers in planning of crops, farming activities and seeds selection help to achieve food security, as well as raising farmers’ knowledge on cooking, storage, dietic nutritional food preparation and feeding practises lead to reduction of number of people suffering from hunger and other related diseases [38].
To achieve food security in Rwanda, different programs were established including crop intensification program (CIP) launched in 2007. CIP is a long-term agriculture transformation policy in Rwanda, which highlights major crops plantation such as: maize, wheat, rice, beans, Irish potatoes and cassava, selected based on suitability with Rwanda agroecological zones, storage and having sufficient local and international market [39]. Therefore, during this study, 13.85% of the respondents from Gashora irrigation site irrigate maize crops, while their counterpart, 3.37% of the respondents cultivate and irrigate beans crops. At the same time, 17.94% of the all respondents from Nasho/Mpanga irrigation site irrigate maize crops; 11.19% of the respondents irrigate the beans crops from Nasho/Mpanga irrigation site, while 0.89% of the respondents irrigate the other crops including the horticultural crops. In addition, for Kagitumba irrigation site, 43.34% of the respondents cultivate and irrigate maize crops, 0.53% of the respondents irrigate rice crops while 8.88% irrigate the beans crops (Figure 3).
In Rwanda, WUA is single entity in charge of signing and implementing the irrigation management contract with Ministry of Agriculture and Animal Resources (MINAGRI) and WUA holds a water use permit with main responsibility of ensuring irrigation infrastructures maintenance. This study revealed that 98% of the farmers who participated in this study were the members of WUA in their respective irrigation site while 2% were not member of any WUA. The different WUA which participated in this study included: Tuyakoreshe-Mpanga lot III WUA created in year 2013; Tuyabyazumusaruro-Mpanga lot II WUA created in year 2012 [40]; Tuyasaranganye-Mpanga lot I WUA created in year 2013; Tuyakoresheneza-Gashora WUA created in year 2016 and Abahuje Umugambi-Kagitumba WUA created in year 2016. Solely the irrigators are the main water abstractor categories which were member of those WUA in Eastern Province of Rwanda.
Both Nasho/Mpanga irrigation site and Kagitumba their WUA possess water use permit whereas for Gashora irrigation site it’s WUAs is not legalised because they do not have water use permit as it is required, therefore, this slows down the functionality of irrigation scheme and implementation of water resources management and irrigation policies. During the interview conducted to the managers of WUAs of Kagitumba and Nasho/Mpanga irrigation site, they highlighted the main aims of their WUAs which included: water allocation among the water users; management of irrigation infrastructures; water use fees collection and management; conflict resolution among the water users and offering other related facilities to farmers for the sake of enhancement of irrigation performance and water use efficiency in general. Usually, the main entry requirements in the WUAs are: Having a plot of land in irrigation scheme which is closer to the waterway; payment of water use fees and cultivating in irrigation scheme. During focused group, the farmers enumerated different main profits they get from WUA such as: getting cheaper and timely irrigation infrastructures repairing services, farm management training, easily getting water subsidies, getting the opportunities to sell their harvest, getting loans from their fellows’ member through tontines and finding collateral which helps them to get loans from different financial institutions.
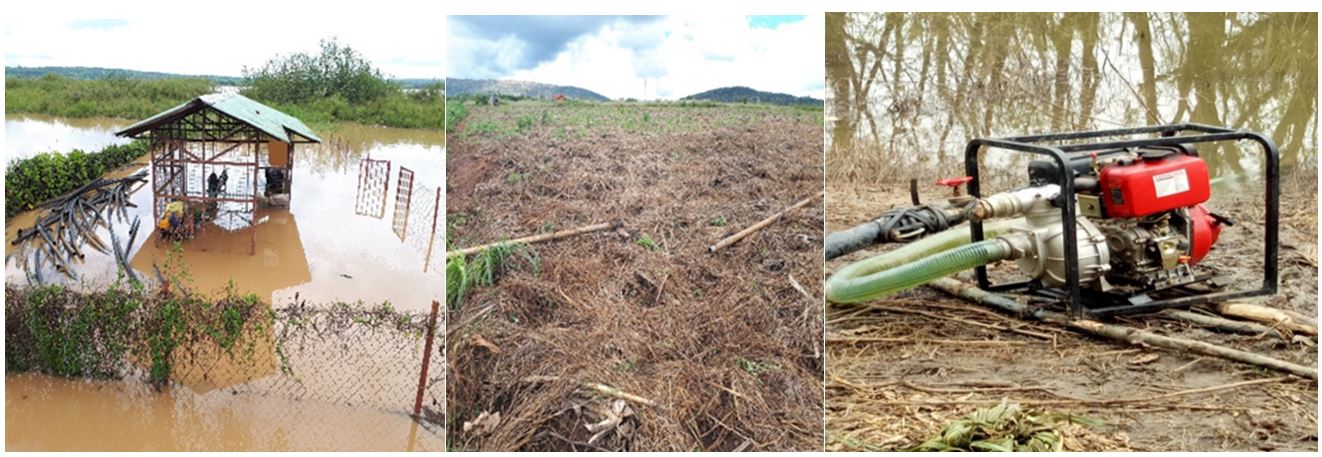
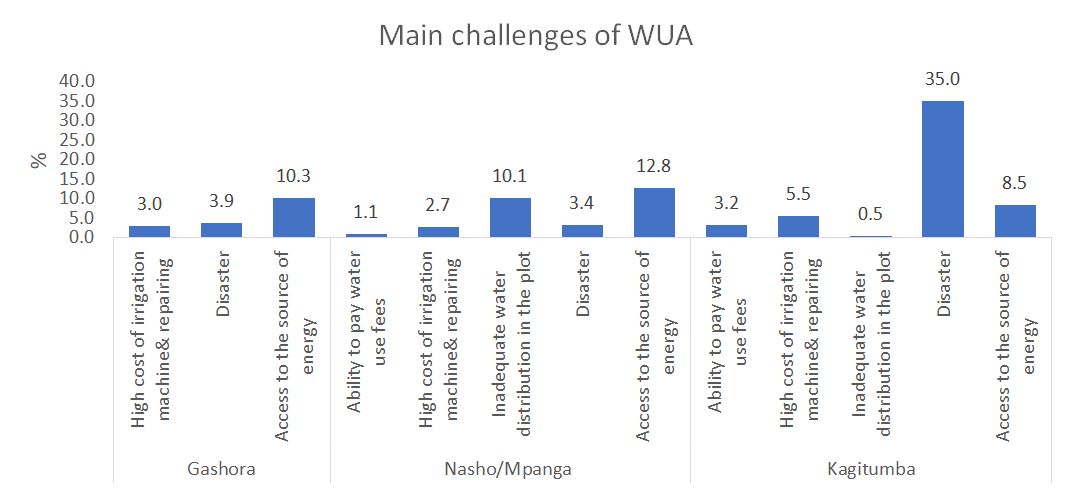
During the survey, major challenges farmers face in their respective WUA, includes the ability to pay water use fees; high cost of irrigation machine and repairing; lack of spare parties on local market, and inadequate water distribution in the plot. Whereby, 3% of the respondents from Gashora irrigation site had a challenge related to high cost of irrigation machineries and repairing of the pumps. Moreover, 3% of the respondents from Gashora irrigation site had a challenge related to the occurrence of disaster flooding and drought. Also, 10.4% encountered the insufficiency of energy source to pump water from the lake, dominated by Gashora irrigation site that use their own pumps to get water from surrounding lakes Mirayi and Rumira (Figure 4).
On the other hand, 1.1% of the respondents from Nasho/Mpanga irrigation site are challenged by ability to pay water use fees due to an imbalance between agriculture inputs and outputs resulted from the market price of the harvest which is lower than the inputs. In addition, 2.7% of the respondents are challenged by high cost of irrigation machine and repairing the damaged infrastructure. The spare parties of pipes which farmers use to irrigate their crops are not sufficient enough on local market, consequently, once there is damage; they cannot be replaced easily which can generate conflicts related to the competition of irrigation materials. Also, 10.2%, of the respondents encountered the challenges related to water distribution in their plots due to lack of reservoirs to store water in and the infrastructures are mobile. Hence, once there is a technical damage the farmers need to wait for the replacement. Moreover, 3.4% of the respondents are challenged by disaster dominated by an extended drought, whereas 12.9% of the respondents are challenged by access to the sufficient source of energy. The electricity supply which the farmers use to pump water from the lake sometimes its threshold became lower than the needed, hence water availability is diminished.
For Kagitumba irrigation site, 3.2% of the respondents have a challenge related to the payment of water use fees but they find its importance meantime an imbalance of agriculture inputs and outputs makes the farmers to get low an income hence ability to pay water use fees becomes a challenge to them. Also 5.6% of the respondents claimed against a high cost of the irrigation machineries and repairing fees while 0.5% enumerated an inadequate water distribution in their plots due to that some farmers turn back the rotation of centre pivot irrigation sprinkler while 35.3% of the farmers claimed about disaster challenge that ruin their crops such as flooding and extended sunny shine period that slows down the irrigation performance in their site. Almost 8.6% of the farmers from have shortage of energy supply to pump water from the water source (Figure 5).
Main water source in irrigation in Eastern Province of Rwanda, come from rivers and lakes. Mirayi and Rumira lakes are the major water source for Gashora irrigation site. Farmers pump water from the lake and store in the dam sheet reservoir hence irrigate their land by gravity which supplement scarce rainfall. However, Nasho/Mpanga irrigation site use water pumped from Cyambwe and Rwampanga lakes with estimated irrigation intensity is estimated to 3.072mm/day. The water source for Kagitumba irrigation site comes from Umuvumba and Akagera rivers pumped and directly used, using either centre pivot irrigation or drip irrigation type with the irrigation intensity estimated to 1.240mm/day. Currently, Eastern Province is under water stress and water scarcity. Generally, different districts of Eastern Province, record low annual rainfall ranging from 700–950 mm comparing to other regions the country which counts over 1200mm annual rainfall [41]. Therefore, irrigation was the major source of water, as an alternative to secure food production. Meantime, the measurement of quantity of water used and pumped from the water source is still a challenge which may cause soil pollution and waterlogging as well as over pumping that can increase water scarcity to the other water bodies.
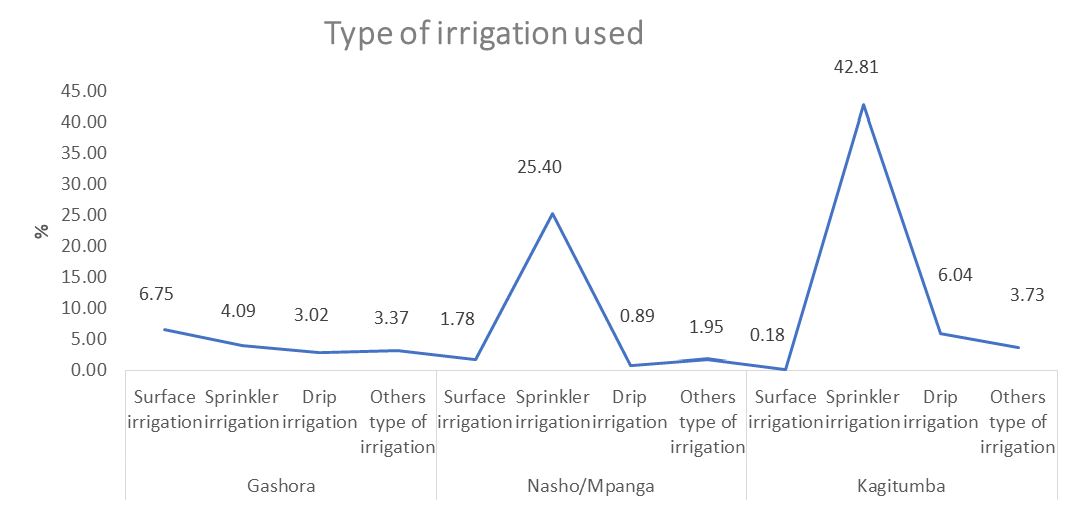
The farmers survey revealed that, at Nasho/ Mpanga irrigation site, 1.78% of all respondents use surface irrigation whereas 25.40% of the respondents use sprinkler irrigation, 0.89% use the drip irrigation and 1.95% of the respondents combines both sprinkler irrigation and drip irrigation. However, for Kagitumba irrigation site, about 0.18% of all respondents from use surface irrigation, while 42.81% of the farmers use sprinkler irrigation. While, 6.04% of the respondents use drip irrigation and 3.73% of the respondents combine both sprinkler and drip irrigation at the same time during their farming activities (Figure 6).
Meantime, from Figure 6, the major farmers use sprinkler irrigation comparing to drip irrigation, while drip irrigation saves water on 56% comparing to water use in furrow irrigation type, at the same time drip irrigation saves water on the rate of 40% more than sprinkler irrigation [42], Therefore, this study recommends the drip irrigation in order to save much water for other water bodies and abstractors.
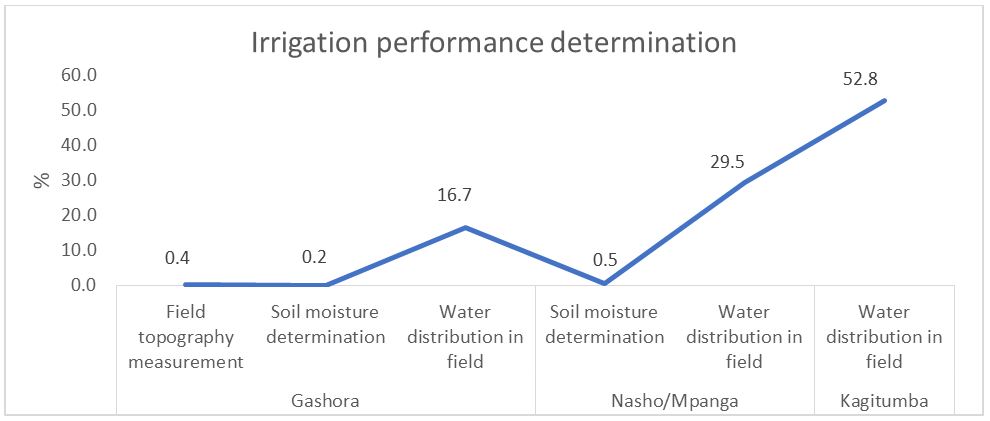
The farmers’ survey, revealed also that 0.4% of the respondents from Gashora irrigation site use field topography measurement whereas 0.2% of the respondents use soil moisture measurement test to measure water distribution in the field. Moreover, 16.7% of the respondents use their own eyes to measure water distribution. For Nasho/Mpanga irrigation site, 0.5% of the respondents use soil moisture to check the water distribution in the field, 29.7% use their own eyes. At Kagitumba irrigation site 52.8% of the respondents use field topography methods to determine water distribution in the field (Figure 7). Therefore, during this in general all irrigation do not record the quantity of water abstracted which can alter negatively the water resources management in the respective irrigation site.
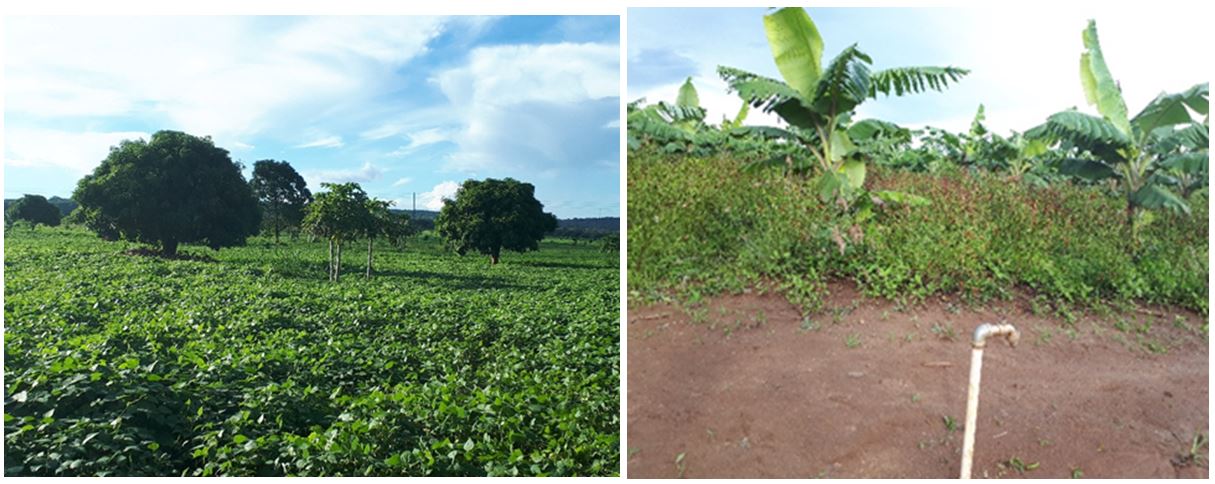
During the transect walk in the respective irrigation site the major types of crops grown were maize, beans and horticultural crops such as banana, citrus sp, mango and papaya. During the focused group discussions on average farmers sow between 22 kg-25kg/ha of seeds of maize. As a return when water source is uniformly available, considering other inputs factors are favourable the yield of maize per hectare varies between 2.5tonnes to 3.5tones. Meanwhile when water shortage occurs, the yield even reaches to 200kg/ha. Referring to the Rwandan agronomist diary of 2018, on average the production of maize per hectare in Rwanda is estimated to vary between 2 to 3 tons of dried grain of maize, which shows that once water is available the production maize in Eastern province may even go higher the expected. But the cultivation of horticultural crops such as tomatoes, papaya and oranges, their yield is counted based on the size of basket known also as Intebo in local language, which is not favourable due to its inefficiency which can increase yield wastage along the value chain from the harvest up to the consumers. Therefore, there is a need to establish a food processing industry to reduce food wastage that will increase the efficiency of water use as well will increase the income of the farmers.
In every irrigation site, there is a lamp sum of money paid by a farmer for repairing the infrastructures once they are damage. These fees help the farmers to adapt and enhance the access to the viable solutions and improvement of technologies, once the incentives or direct support from the government or private is not available or delayed [43]. In this regard, the farmers of Eastern province of Rwanda pay the water use fees to the elected WUA leader and during the general assembly of the WUA, decide which activity to be paid by the farmers and initiate it. Hence, this helps the government to sustain the infrastructures initiated.
During the survey 77.4% of the respondents pay water use fees dominated by Nasho/Mpanga and Kagitumba irrigation site while 22.6% do not, mostly dominated by the farmers of Gashora irrigation site. The payment of water use fees is based on land size which is under cultivation in the irrigation site and the type of crops per season of agriculture. Therefore, for Nasho/ Mpanga irrigation site, normally the payment is based on the minimum land size estimated to 150sqm and a farmer is required to pay 6000frw (~ $7.5)/ 150 sqm. However, for beans cultivation, a farmer pays per season of agriculture 4500frw (= ~ $5.3) and horticultural crops 5000frw/150sqm (= ~ $5.9) per season of Agriculture.
Note that Rwandan agriculture season consist of three seasons such as: Season A, starting from September ending in February; while season B starts in March ends in June; then starts C in July and ends in September of the same year. Meantime, during the focused group, the farmers of Eastern province of Rwanda are still being challenged by access to finance and collateral in order to get the loans from the bank which may help them to expand their farming activities. Due to that the agriculture sector, is regarded as risky sector and the financial institutions fear to invest money in it. Currently 6% of total loan given by all financial instutions was issued in agriculture while the rest was invested in other business, hence, as over 80% of the population are the agriculture farmers becomes a challenge to access to finance [44]. An interview conducted to the key informant in charge of agriculture, they highlighted that the public sector is nowadays investing much in the training of the farmers on value addition of their harvest in order to boost their income. As well the government invested different subsidies to enable the farmers to buy the seeds of major crops proposed by crop intensification program and to be able to purchase the fertiliser and irrigation machines.
General aim of this study was to assess the role of water user’s association in the irrigation performance at local level in Eastern Province of Rwanda. The main purpose was to assess the role of people participation and contribution of WUA on irrigation performance. The major performance indicators assessed include technical, agronomic and economic performance indicators. This study used different methods, such as transect walk, farmers survey, focused group discussions and key informant interviews. This study revealed that the farmers of eastern province use rivers and lakes as major source of water for the irrigation dominated by sprinkler irrigation and surface, which are considered not economically water saver comparing to the drip irrigation. Their participation in irrigation performance appears in the repairing the damaged infrastructures through the communal works (Umuganda) with help of irrigation technicians and agriculture extensionist. In addition, decentralisation of water management activities in the WUA helped the farmers to get the incentives, loans, and solving the conflicts that may arise among themselves related to water competition. Meantime, the major challenges of WUA are related to energy supply, water allocation calendar and effect of disasters. The main methods used to measure water distribution include soil moisture test, field topography method and eyes but the measurement of water abstracted is not suitable. The technical performance of the irrigation in Eastern Province is challenged by the unavailability of the spare party of some irrigation equipment as well as the measurements of the quantity of water pumped is not done which may result to high water abstraction from the source. In addition, the agronomic performance, the farmers indicated that the market of their harvest is not proportional to their inputs as well some horticultural yield is spoiled due to lack of agro-processing industry at production farm. As concluded this research is considered as a mile stone for researchers, due to the primary data it provides, that will equip the policymakers with evidence based on the impact of established water policy on agriculture productivity and water use efficiency in irrigation.
This research was carried out as one of the requirements to get joint master’s degree at Pan African University and Abou-Bekr Belkaid University of Tlemcen, Algeria, therefore, the author is acknowledging both scholarship and research grant gotten from African Union Commission. Much thanks, also to the L.I.M department, of Rwanda Agriculture Board for the guidance and support during data collection from the field.